

The Hidden Cost of 70% Bounce Rates: How It's Killing Your Shopify Revenue
Author: Robert Rose
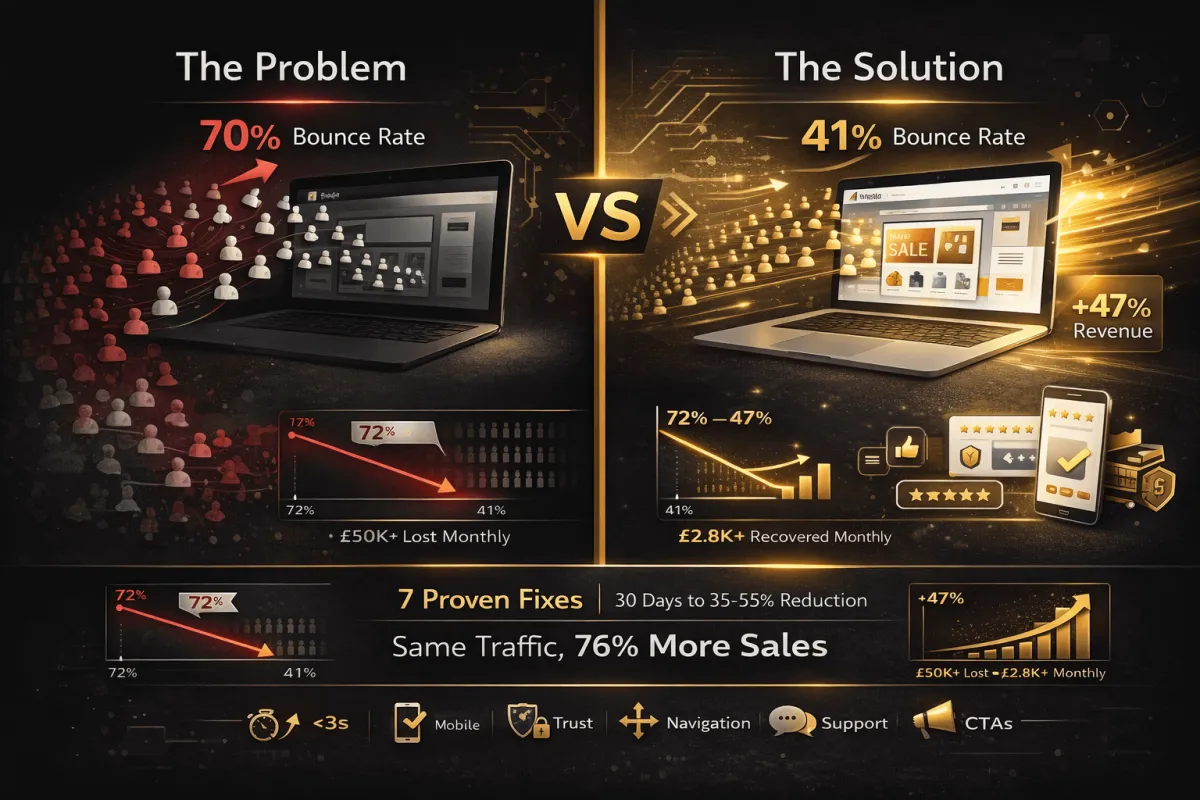
70% of your visitors leave your store within seconds without making a purchase.
They don't add to the cart. They don't browse. They just... bounce.
For a Shopify store doing £75,000 monthly with 6,000 visitors, that means 4,200 people leave immediately every month - taking £50,000+ in potential revenue with them.
The worst part? Most store owners think this is normal. "That's just how e-commerce works," they say.
It's not. And it's costing you a fortune.
I'm going to show you exactly why visitors bounce, how much it's actually costing you, and the 7 fixes that reduced my bounce rate from 72% to 41% (and increased revenue by 47%).
What Is Bounce Rate? (And Why It Matters)
Bounce rate = the percentage of visitors who leave your site after viewing only one page.
They land on your store, look around for 5-30 seconds, and leave. No second page. No adding to cart. No purchase.
Why High Bounce Rates Kill Your Business
1. Lost Revenue
70% bounce rate on 6,000 monthly visitors = 4,200 wasted visits
If just 3% would have bought (£65 average order) = £8,190 monthly loss
2. Wasted Ad Spend
You paid £2-5 per click to get them there
4,200 bounces × £3 average = £12,600 wasted monthly on ads
3. SEO Damage
Google sees a high bounce rate as "bad user experience"
Your rankings drop
You get even less organic traffic
4. Poor First Impressions
Visitors who bounce rarely return
You lost them forever
They buy from competitors instead
What's a "Good" Bounce Rate?
E-Commerce Benchmarks:
20-40% = Excellent
40-55% = Good
55-65% = Average
65-75% = Poor
75%+ = Critical problem
My stores typically achieve 38-45% after optimisation.
The 7 Bounce Rate Killers (And How to Fix Each One)
Killer #1: Slow Loading Speed
The Problem:
1-3 seconds load time: Normal bounce rate
3-5 seconds: +32% bounce rate increase
5-10 seconds: +90% bounce rate increase
10+ seconds: +123% bounce rate increase
People won't wait. They'll leave immediately.
How to Fix It:
Quick Wins (Do These Today):
Compress Images
Use TinyPNG or ImageOptim
Target: Under 200KB per image
Save images as WebP format
Lazy load images (load as user scrolls)
Remove Unused Apps
Each Shopify app adds to the loading time
Uninstall apps you don't actively use
Check: 5+ apps = probably too many
Enable Browser Caching
Add to your theme code (via developer or app)
Stores static files locally
Repeat visitors load faster
Minimise Code
Use apps like "Page Speed Optimiser"
Combines and compresses CSS/JavaScript
Reduces the number of server requests
Use a Fast Theme
Shopify's Dawn theme is fast
Avoid heavy, bloated themes
Test your current theme speed
Test Your Speed:
Google PageSpeed Insights
GTmetrix
Pingdom
Target: Under 3 seconds on mobile
Expected Impact: Reduces bounce rate by 15-25%
Killer #2: Poor Mobile Experience
The Problem:
60-70% of e-commerce traffic is mobile. If your store looks broken on phones, you're losing most of your visitors.
Common Mobile Mistakes:
Text too small to read
Buttons too small to tap
Horizontal scrolling required
Pop-ups covering the entire screen
Slow loading on mobile data
How to Fix It:
Test on Real Devices
Check on iPhone and Android
Test on different screen sizes
Try a slow 3G connection
Simplify Mobile Navigation
Large, tappable menu buttons
Sticky menu at the top
Search bar prominent
Maximum 3 clicks to any product
Optimise Mobile Images
Mobile-specific image sizes
Smaller file sizes
Portrait orientation for product photos
Reduce Mobile Pop-ups
Delay pop-ups 30+ seconds on mobile
Make them easy to close (big X button)
Don't cover the whole screen
Mobile-Friendly Checkout
Auto-fill address fields
Apple Pay / Google Pay integration
Large form fields
Minimal required information
Expected Impact: Reduces bounce rate by 10-20%
Killer #3: Unclear Value Proposition
The Problem:
Visitors land on your homepage and think: "What do you sell? Why should I care?"
If they can't answer in 5 seconds, they leave.
How to Fix It:
Above the Fold (Visible without scrolling), Include:
Clear Headline
What you sell
Who it's for
Main benefit
Bad: "Welcome to Our Store!" Good: "Organic Hair Care for Natural Curls - Trusted by 10,000+ Customers"
Supporting Subheadline
Expand on the main benefit
Address the main pain point
Create urgency or interest
Example: "Sulfate-free, dermatologist-tested products that actually work. Get healthier, more defined curls in 14 days or your money back."
Visual Proof
High-quality hero image
Show product in use
Happy customer photo
Before/after, if applicable
Trust Indicators
Customer reviews (star rating)
"As seen in" logos
Customer count
Certifications
Expected Impact: Reduces bounce rate by 5-15%
Killer #4: No Social Proof
The Problem:
First-time visitors don't trust you. Without proof that others have bought and loved your products, they won't risk their money.
How to Fix It:
Display Reviews Prominently
Show star ratings on homepage
Feature the best reviews
Include customer photos
Response to reviews (shows you care)
Add Trust Badges
Payment security (SSL, Norton, McAfee)
Certifications (organic, vegan, etc.)
Money-back guarantee
Free returns policy
Show Real-Time Social Proof
"Sarah from London just purchased..."
"247 people viewing this product"
"Only 3 left in stock"
"23 sold in the last 24 hours"
Add Testimonials
Homepage testimonial section
Video testimonials (best)
Specific results mentioned
Photos of real customers
Display Customer Count
"Trusted by 12,000+ customers"
"50,000+ products sold"
"4.8★ average rating (2,147 reviews)"
Expected Impact: Reduces bounce rate by 8-15%
Killer #5: Confusing Navigation
The Problem:
Visitors can't find what they're looking for. Complex menus, unclear categories, no search function = instant bounce.
How to Fix It:
Simplify Your Menu
Maximum 6-7 main categories
Clear, descriptive names
Logical groupings
Don't hide important pages
Prominent Search Bar
Always visible at the top
Large enough to notice
Predictive search (shows results as they type)
Search by product name, category, or concern
Clear Category Names
Bad categories:
Products
Stuff
Shop All
Collection
Good categories:
Shampoos & Conditioners
Hair Treatments
Styling Products
Kids Products
Breadcrumb Navigation
Shows where they are: Home > Hair Care > Shampoos
Easy to backtrack
Improves UX
Filter Options
Filter by hair type
Filter by concern (dryness, breakage, etc.)
Filter by price range
Sort by popularity/price/rating
Expected Impact: Reduces bounce rate by 10-20%
Killer #6: No Live Support
The Problem:
The visitor has a question. No one to ask. They leave and buy from a competitor who has live chat.
How to Fix It:
AI Chatbot (Essential)
Available 24/7
Instant responses
Answers common questions
Can recommend products
See our complete AI Chatbot guide
Proactive Chat Offers
Trigger after 30-45 seconds on the page
"Need help finding the right product?"
Offer help before they ask
Don't wait for them to open chat
Clear Contact Options
Multiple contact methods are visible
Phone number (if you offer phone support)
Email (with fast response time)
Social media links
FAQ page
Expected Response Times
Tell them: "We respond in under 2 hours"
Show business hours clearly
Set expectations
Actually meet those expectations
Expected Impact: Reduces bounce rate by 15-25%
Killer #7: Weak Calls-to-Action
The Problem:
Visitors don't know what to do next. Unclear buttons, generic CTAs, no guidance = they leave.
How to Fix It:
Strong, Clear CTAs
Bad CTAs:
"Click Here"
"Learn More"
"Submit"
"Enter"
Good CTAs:
"Shop Curly Hair Products"
"Find My Perfect Shampoo"
"Get 20% Off First Order"
"See Customer Results"
CTA Button Design
High contrast colour (stands out)
Large enough to click easily
Rounded corners (more inviting)
Obvious clickability
White space around it
Multiple CTAs
Different CTAs for different visitor intents
"Shop Now" for ready buyers
"Take Quiz" for those unsure
"Read Reviews" for researchers
"Contact Us" for those with questions
CTA Placement
Above the fold (primary CTA)
Middle of page (secondary CTA)
Bottom of page (final CTA)
Sidebar (persistent)
Expected Impact: Reduces bounce rate by 5-12%
The Complete Fix Implementation Timeline
Week 1: Quick Wins
Time Investment: 4-6 hours
[ ] Compress all product images
[ ] Remove unused apps
[ ] Test site on mobile devices
[ ] Fix critical mobile issues
[ ] Add prominent search bar
Expected Impact: 10-15% bounce rate reduction
Week 2: Content & Trust
Time Investment: 6-8 hours
[ ] Rewrite homepage headline + subheadline
[ ] Add trust badges
[ ] Feature customer reviews on homepage
[ ] Add "as seen in" or certifications
[ ] Create FAQ page
Expected Impact: Additional 8-12% reduction
Week 3: Navigation & UX
Time Investment: 5-7 hours
[ ] Simplify main menu
[ ] Improve category names
[ ] Add filtering options
[ ] Implement breadcrumb navigation
[ ] Test navigation flow
Expected Impact: Additional 7-10% reduction
Week 4: Live Support & CTAs
Time Investment: 4-6 hours
[ ] Install AI chatbot
[ ] Set up proactive chat triggers
[ ] Rewrite all CTAs
[ ] Improve CTA button design
[ ] Add multiple CTA options
Expected Impact: Additional 12-18% reduction
Total Expected Improvement: 35-55% bounce rate reduction
Measuring Your Progress
Track These Metrics Weekly
In Google Analytics:
Overall Bounce Rate
Site-wide average
Track weekly trend
Target: Under 55%
Page-Specific Bounce Rates
Homepage
Product pages
Collection pages
Landing pages
Device Bounce Rates
Mobile
Desktop
Tablet
Fix the worst performer first
Traffic Source Bounce Rates
Organic search
Paid ads
Social media
Email
Different audiences behave differently
Before and After Comparison
Baseline (Week 0):
Overall Bounce Rate: 72%
Mobile Bounce Rate: 79%
Desktop Bounce Rate: 64%
Average Session Duration: 1:08
Pages per Session: 1.3
Target (Week 4):
Overall Bounce Rate: 45% (27% improvement)
Mobile Bounce Rate: 52% (27% improvement)
Desktop Bounce Rate: 38% (26% improvement)
Average Session Duration: 2:15 (66% improvement)
Pages per Session: 2.8 (115% improvement)
Real Results from My Implementations
Case Study: Black Hair Care UK
Before Optimisation:
Bounce Rate: 72%
Monthly Visitors: 3,200
Conversions: 58
Revenue: £3,770
After 30-Day Optimisation:
Bounce Rate: 41% (31% improvement)
Monthly Visitors: 3,200 (same traffic)
Conversions: 102 (76% increase)
Revenue: £6,630 (76% increase)
What Changed:
Compressed images (3.2s → 1.8s load time)
Added AI chatbot
Rewrote homepage value prop
Added prominent reviews
Simplified navigation
ROI: £2,860 additional monthly revenue from same traffic
Common Mistakes to Avoid
Mistake #1: Focusing Only on Traffic
Problem: Getting more visitors won't help if they all bounce.
Fix: Optimise bounce rate first, then scale traffic.
Mistake #2: Ignoring Mobile
Problem: 70% of your traffic is mobile, but you only test on desktop.
Fix: Mobile-first design and testing.
Mistake #3: Too Many Pop-ups
Problem: Aggressive pop-ups that cover content drive people away.
Fix: Maximum 1 pop-up per visit, delay 30+ seconds, easy to close.
Mistake #4: Generic Stock Photos
Problem: Fake-looking stock photos reduce trust.
Fix: Use real product photos, customer photos, and authentic imagery.
Mistake #5: Not Testing Changes
Problem: Making changes without measuring impact.
Fix: Change one thing, measure for a week, then change the next thing.
Your 30-Day Bounce Rate Fix Plan
Week 1: Technical Performance
Speed optimisation
Mobile fixes
Remove friction
Week 2: Trust & Social Proof
Add reviews
Trust badges
Testimonials
Week 3: Navigation & UX
Simplify menu
Improve search
Clear categories
Week 4: Engagement & Support
Install chatbot
Improve CTAs
Proactive help
Expected Results:
35-55% bounce rate reduction
40-80% conversion increase
40-80% revenue increase (from the same traffic)
Get Expert Help Optimising Your Store
Reducing bounce rate requires analysing your specific store, understanding your visitors, and implementing the right fixes in the right order.
The 5-Pillar AI Revenue Machine includes:
Complete bounce rate analysis
Customised optimisation plan
Technical implementation
A/B testing and refinement
Guaranteed improvement
Book Your Free AI Readiness Assessment
We'll analyse:
Your current bounce rate
Biggest issues hurting conversions
Specific fixes for your store
Expected improvement timeline
Limited to 5 Assessments Per Month
Last Updated: January 2025
Related Articles:
